Pandas and DataFrames

Pandas is a python library. Pandas will help you to explore, clean, and process your data. In pandas, a data table is called a DataFrame. We use to import the library using "import pandas as pd".
When looking at a data set, check to see what data needs to be cleaned. Examples include:

  • Missing Data Points
  • Invalid Data
  • Inaccurate Data
    Example below:
import pandas as pd

df = pd.read_json('files/grade.json')

print(df)
   Student ID Year in School   GPA
0         123             12  3.57
1         246             10  4.00
2         578             12  2.78
3         469             11  3.45
4         324         Junior  4.75
5         313             20  3.33
6         145             12  2.95
7         167             10  3.90
8         235      9th Grade  3.15
9         nil              9  2.80
10        469             11  3.45
11        456             10  2.75

For example, the grade of the students were not unity.

Titanic Hack

import pandas as pd
import seaborn as sns

# Load the titanic dataset
titanic_data = sns.load_dataset('titanic')

print("Titanic Data")


print(titanic_data.columns) # titanic data set

print(titanic_data[['survived','pclass', 'sex', 'age', 'sibsp', 'parch', 'class', 'fare', 'embark_town']])
Titanic Data
Index(['survived', 'pclass', 'sex', 'age', 'sibsp', 'parch', 'fare',
       'embarked', 'class', 'who', 'adult_male', 'deck', 'embark_town',
       'alive', 'alone'],
      dtype='object')
     survived  pclass     sex   age  sibsp  parch   class     fare  \
0           0       3    male  22.0      1      0   Third   7.2500   
1           1       1  female  38.0      1      0   First  71.2833   
2           1       3  female  26.0      0      0   Third   7.9250   
3           1       1  female  35.0      1      0   First  53.1000   
4           0       3    male  35.0      0      0   Third   8.0500   
..        ...     ...     ...   ...    ...    ...     ...      ...   
886         0       2    male  27.0      0      0  Second  13.0000   
887         1       1  female  19.0      0      0   First  30.0000   
888         0       3  female   NaN      1      2   Third  23.4500   
889         1       1    male  26.0      0      0   First  30.0000   
890         0       3    male  32.0      0      0   Third   7.7500   

     embark_town  
0    Southampton  
1      Cherbourg  
2    Southampton  
3    Southampton  
4    Southampton  
..           ...  
886  Southampton  
887  Southampton  
888  Southampton  
889    Cherbourg  
890   Queenstown  

[891 rows x 9 columns]

Dataset Hack

import pandas as pd

dataset = [
  {
    "name": "PRECIOUS ACHIUWA",
    "team": "TOR",
    "age": 23,
    "height": 2.03,
  },
  {
    "name": "STEVEN ADAMS",
    "team": "MEM",
    "age": 29,
    "height": 2.11,
  },
  {
    "name": "BAM ADEBAYO",
    "team": "MIA",
    "age": 25,
    "height": 2.06,
  },
  {
    "name": "OCHAI AGBAJI",
    "team": "UTA",
    "age": 22,
    "height": 1.96,
  }
]

df = pd.DataFrame(dataset)

print(df)

print("Oldest: " +str(df["age"].max()))
print("Youngest: " + str(df["age"].min()))
print("Tallest: " + str(df["height"].max()))
print("Shortest: " + str(df["height"].min()))
               name team  age  height
0  PRECIOUS ACHIUWA  TOR   23    2.03
1      STEVEN ADAMS  MEM   29    2.11
2       BAM ADEBAYO  MIA   25    2.06
3      OCHAI AGBAJI  UTA   22    1.96
Oldest: 29
Youngest: 22
Tallest: 2.11
Shortest: 1.96

Quiz Reflection

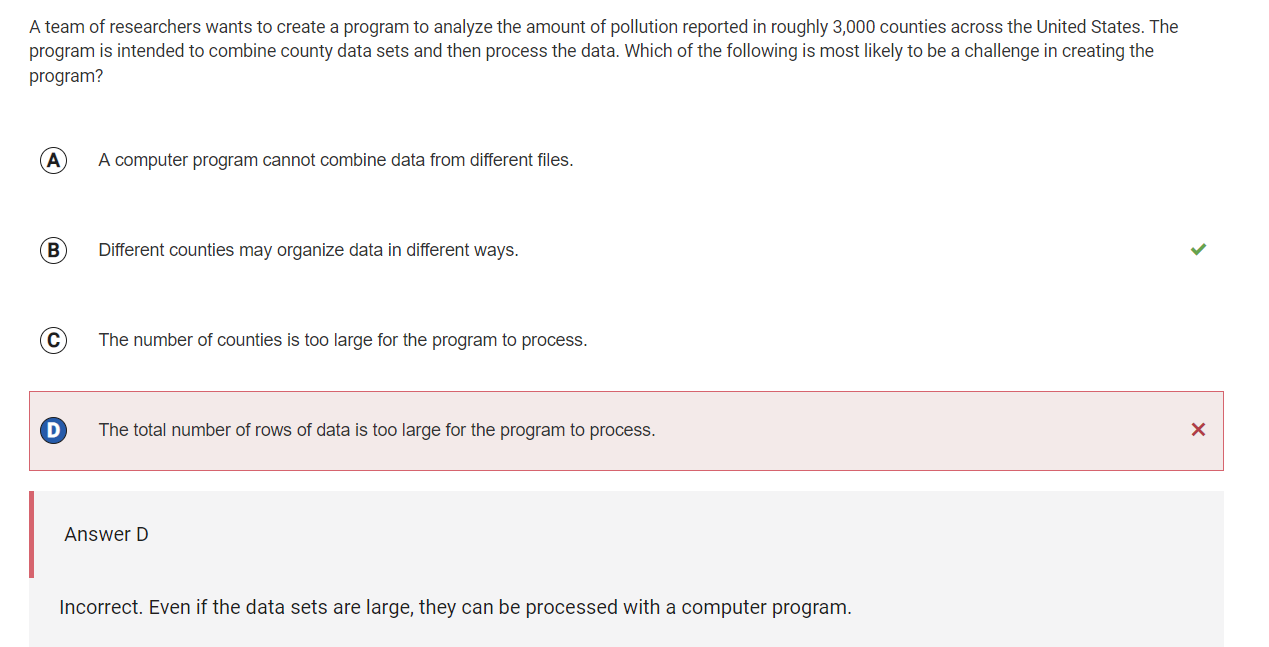
For the first wrong question, B is correct because it will be a challenge to clean the data from the different counties to make the data uniform.

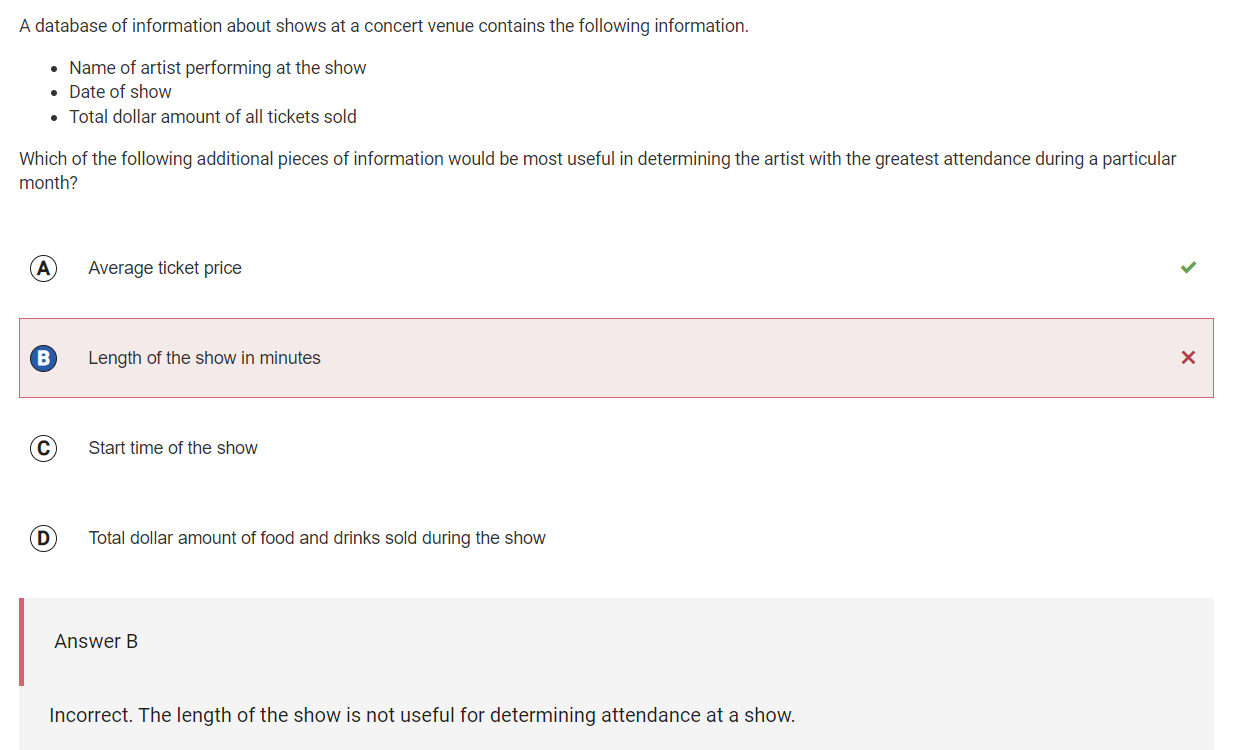
For the second wrong question, A is correct because the attendance for a particular show can be calculated dividing the total dollar amount of all tickets sold by the average ticket price.